Science for practice
Statistical Analysis and Forecasting of the Dynamics of Weightlifters' Top Performances
English summary of Tyazhelaya Atletika. Ezhegodnik 1984 (Moscow: Fizkultura i Sport, 1984), pp. 53–58: the text is paraphrased, not translated; data tables are given in full with English labels; figures are the original images.
Selecting and preparing athletes, planning, forecasting and applied research all rely on analysing results over set periods, and the dynamics of world records is a natural yardstick for judging and predicting individual performances. Earlier studies forecast from Olympic totals, world-record totals, the six best lifters' results, the ten best two-lift totals of a year regardless of class, or records in the lifts and the two-lift total. All of them extrapolate point or interval data, usually the best result of each year. Extrapolation merely extends the trend of past observations, so the probability of a forecast and the confidence intervals of the predicted results have to be stated; the authors found neither in the published work, which also lacks high-level generalisation and the method of ascending from the abstract to the concrete.
Because weight classes differ, researchers had to analyse them separately; the one exception, A. V. Chernyak (1970), converted kilograms into conventional units by a formula. Starodubtsev's method of expressing results in comparable scores (1962–82) exposes the general trend of achievement across all classes and, from it, allows forecasts for individual classes. The task here was to study the dynamics of world records from 1947 to 1983 (records counted up to 1 December) and forecast the two-lift total, with justified confidence intervals, for the next three years.
Dynamics are studied through time series, in which successive periods are listed against the observations belonging to them, the levels of the series. The levels must be homogeneous and comparable, so two conventions were adopted. First, until 1973, when world records in the two-lift total began to be registered, the top performance was taken as the sum of the snatch and clean-and-jerk records rounded down to a multiple of 2.5 kg. In 1965, for instance, the lightweight (67.5 kg) records were 134 and 168.5 kg, giving 300 kg (132.5 + 167.5); from 1973 the official total records, which exceed such sums, replace them. Second, kilograms were converted into conventional units (c.u.) with the table of comparable scores (Starodubtsev, 1981), the over-110 kg scale being used for the heaviest class in every year. The resulting series, their means and coefficients of variation are in Table 1.
Table 1. Time series of world records in the two-lift total in comparable scores (c.u.)
| Year | Weight class, kg | Over 82.5; over 90; over 110 | Mean | Coefficient of variation, % | ||||||||
| 52 | 56 | 60 | 67.5 | 75 | 82.5 | 90 | 100 | 110 | ||||
| 1947 | — | 287 | 314 | 327 | 320 | 311 | — | — | — | 262 | 303.5 | 8.5 |
| 1948 | — | 311 | 328 | 327 | 320 | 311 | — | — | — | 274 | 311.8 | 6.8 |
| 1949 | — | 326 | 328 | 327 | 320 | 311 | — | — | — | 274 | 317.3 | 6.5 |
| 1950 | — | 331 | 328 | 327 | 328 | 314 | — | — | — | 279 | 317.8 | 6.8 |
| 1951 | — | 331 | 332 | 327 | 328 | 314 | 304 | — | — | 285 | 317.3 | 5.5 |
| 1952 | — | 331 | 332 | 332 | 331 | 318 | 331 | — | — | 288 | 321.4 | 5.1 |
| 1953 | — | 331 | 337 | 336 | 339 | 321 | 321 | — | — | 291 | 325.1 | 5.5 |
| 1954 | — | 336 | 346 | 340 | 339 | 325 | 328 | — | — | 300 | 330.6 | 5.1 |
| 1955 | — | 346 | 351 | 340 | 343 | 325 | 328 | — | — | 303 | 333.7 | 5.3 |
| 1956 | — | 361 | 351 | 344 | 343 | 332 | 328 | — | — | 303 | 337.4 | 6.4 |
| 1957 | — | 366 | 351 | 344 | 343 | 332 | 343 | — | — | 303 | 339.1 | 6.9 |
| 1958 | — | 372 | 365 | 352 | 343 | 332 | 335 | — | — | 303 | 343.1 | 7.4 |
| 1959 | — | 377 | 365 | 352 | 343 | 339 | 335 | — | — | 309 | 346.4 | 7.3 |
| 1960 | — | 377 | 365 | 357 | 347 | 343 | 335 | — | — | 318 | 348.9 | 5.6 |
| 1961 | — | 377 | 370 | 361 | 351 | 343 | 342 | — | — | 336 | 354.3 | 4.3 |
| 1962 | — | 377 | 379 | 365 | 355 | 350 | 342 | — | — | 336 | 357.7 | 4.4 |
| 1963 | — | 377 | 384 | 369 | 362 | 357 | 342 | — | — | 345 | 366.1 | 4.2 |
| 1964 | — | 382 | 394 | 382 | 370 | 361 | 345 | — | — | 357 | 370.1 | 4.9 |
| 1965 | — | 387 | 394 | 382 | 370 | 361 | 349 | — | — | 357 | 371.4 | 4.5 |
| 1966 | — | 392 | 394 | 382 | 382 | 368 | 349 | — | — | 357 | 374.9 | 4.4 |
| 1967 | — | 397 | 399 | 391 | 386 | 372 | 352 | — | — | 386 | 379.6 | 4.6 |
| 1968 | — | 408 | 399 | 391 | 394 | 372 | 370 | — | — | 394 | 385.4 | 4.2 |
| 1969 | 379 | 408 | 399 | 379 | 379 | 376 | 373 | — | 344 | 564 | 380.9 | 5.6 |
| 1970 | 384 | 408 | 399 | 391 | 394 | 380 | 384 | — | 366 | 376 | 386.4 | 3.7 |
| 1971 | 390 | 408 | 404 | 400 | 394 | 387 | 390 | — | 376 | 389 | 393.2 | 2.7 |
| 1972 | 401 | 413 | 408 | 404 | 398 | 402 | 401 | — | 389 | 398 | 401.0 | 2.7 |
| 1973 | 407 | 413 | 408 | 404 | 402 | 402 | 407 | — | 392 | 392 | 402.8 | 1.8 |
| 1974 | 407 | 413 | 408 | 404 | 406 | 406 | 423 | — | 392 | 401 | 406.7 | 2.1 |
| 1975 | 413 | 413 | 413 | 404 | 406 | 410 | 427 | — | 416 | 413 | 412.6 | 1.9 |
| 1976 | 413 | 413 | 418 | 404 | 413 | 421 | 434 | — | 416 | 424 | 417.4 | 2.1 |
| 1977 | 424 | 413 | 418 | 408 | 418 | 421 | 424 | 396 | 416 | 427 | 417.5 | 3.0 |
| 1978 | 424 | 413 | 423 | 408 | 418 | 429 | 424 | 402 | 416 | 427 | 419.4 | 2.4 |
| 1979 | 424 | 418 | 428 | 439 | 418 | 448 | 434 | 413 | 416 | 427 | 426.5 | 2.7 |
| 1980 | 424 | 424 | 433 | 457 | 439 | 464 | 434 | 439 | 423 | 427 | 434.8 | 3.8 |
| 1981 | 424 | 440 | 448 | 462 | 439 | 464 | 453 | 424 | 429 | 430 | 443.3 | 2.9 |
| 1982 | 436 | 445 | 448 | 462 | 447 | 464 | 460 | 451 | 440 | 443 | 449.6 | 2.0 |
| 1983 | 453 | 472 | 468 | 462 | 453 | 464 | 464 | 466 | 446 | 447 | 459.7 | 1.8 |
As printed; the 1969 value 564 in the last class column is evidently a misprint, and the text gives the 1947 coefficient of variation as 8.2 %.
World records in all classes rose unevenly and were often left unbroken for several years, typically when the c.u. value of a record in one or more classes far exceeded that year's mean, as if the lifters who set them were running ahead of their time (Yu. A. Sandalov). The class mean, by contrast, almost always rose continuously, falling only in years when new classes were introduced: 1951 (90 kg and over 90 kg) and 1969 (52, 110 and over 110 kg); the introduction of the 100 kg class in 1977 also cut the annual gain markedly. The spread between classes shrank, the coefficient of variation dropping from 8.2 % in 1947 to 1.8 % in 1983, so that levels in different classes are converging. It is also notable that in 1947 only the lightweight record total exceeded the 1981–84 USSR master of sport standard, by 2.5 kg, while the heavyweight record (then over 82.5 kg) equalled today's first-class norm: growth in performance changes ideas of what a standard is.
Table 2 gives the normalised relative gain and mean absolute gain (c.u.) of the records. The normalised gain is essentially a criterion of how effective a training cycle was for lifters of each class. It is measured against a 400 kg (464 c.u.) total in the 82.5 kg class:
E2 = 0.000464 r2(r2 − r1),
where E2 is the normalised gain of the two-lift total, r2 the score of the top performance at the end of the period and r1 at its start, in c.u. Six periods were distinguished: 1947–68 and 1969–82, split by the 1969 introduction of the 52, 110 and over 110 kg classes; three equal periods within 1970–82; and the whole series 1947–83.
Table 2. Normalised and mean gains of world records in the two-lift total
| Weight class, kg | Normalised gain, % | Mean gain, c.u. | ||||||||
| Periods | ||||||||||
| 1947–1968 | 1969–1982 | 1947–1982 | 1970–1974 | 1974–1978 | 1978–1982 | 1977–1983 | 1977–1979 | 1980–1982 | 1981–1983 | |
| 52 | — | 11.5 | — | 4.3 | 3.3 | 2.4 | 4.8 | 0.0 | 6.0 | 14.5 |
| 56 | 22.9 | 6.8 | 32.6 | 1.0 | 0.0 | 6.6 | 9.8 | 2.5 | 5.5 | 16.0 |
| 60 | 15.7 | 10.2 | 27.9 | 1.7 | 2.9 | 5.2 | 8.3 | 5.0 | 7.5 | 10.0 |
| 67.5 | 11.6 | 15.2 | 28.9 | 2.4 | 0.8 | 11.6 | 9.0 | 15.5 | 2.5 | 0.0 |
| 75 | 13.5 | 11.0 | 26.3 | 2.3 | 2.3 | 6.0 | 6.2 | 0.0 | 4.0 | 8.0 |
| 82.5 | 10.5 | 18.9 | 32.9 | 4.9 | 4.6 | 7.5 | 7.2 | 13.5 | 0.0 | 0.0 |
| 90 | — | 18.6 | — | 8.3 | 2.2 | 5.5 | 5.0 | 0.0 | 13.0 | 5.5 |
| 100 | — | — | — | — | — | 10.3 | 11.7 | 8.5 | 19.0 | 11.0 |
| 110 | — | 19.6 | — | 4.7 | 4.6 | 4.9 | 5.0 | 0.0 | 8.5 | 8.5 |
| Over 82.5; 90; 110 | 17.2 | 16.2 | 37.2 | 4.7 | 5.2 | 3.3 | 3.3 | 0.0 | 8.0 | 8.5 |
| Average | 15.2 | 14.2 | 31.0 | 3.8 | 2.9 | 6.3 | 7.0 | 4.5 | 7.4 | 8.2 |
In 1947–68 the normalised gain was greatest in the extreme classes, lightest and heaviest, and smallest at 82.5 kg, with a coefficient of variation of 29.6 %, very large by the standards of sports metrology. In 1969–82 the leaders became the 110, 82.5 and 90 kg classes and the 56 kg class lagged, probably because the new 52 kg class drew many promising lifters away from it. Variability of the gains was very high in both periods, yet their means were practically equal although the periods last 21 and 13 years. The averages over equal periods show the jumpy pattern. Gains in 1970–74 and 1974–78 differ insignificantly (p > 0.05), whereas 1978–82 shows a reliable increase (p = 0.05). The same happened earlier: the mean normalised gains for 1950–54, 1954–58, 1960–64 and 1964–68 were 1.2, 2, 4.6 and 2.7 %. This persistent, stepwise rise in training effectiveness can be attributed to better living standards, progress in sports science, better selection, methods and organisation of training, and more effective training and recovery means.
Over 1947–82 the largest normalised gain was in the heaviest class, and it stays first even at E2 = 33.9 % if the 1947 result (310 kg) is scored on the 110 kg table. The mean over all classes was 31 %, with a coefficient of variation of 12.9 %, a medium dispersion; growth was more effective in the classes from 82.5 kg upward. Weight class therefore has little effect on how effectively records grow, although heavier lifters have a slight advantage. These tendencies should carry into the near future and be reflected in forecasts.
The main task in analysing a time series is to find the general tendency, here a jumpy progress of world records. To express it as a function the series has to be smoothed analytically, and the most informative period chosen: the final stage, dated from 1977, when the 100 kg class completed the set of weight classes and, as shown, a new jump in the effectiveness of growth began.
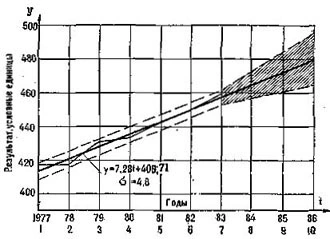
The form of the trend depends on how fast the levels change, so the mean gain is needed: ΔY = (Yn − Y1)/(n − 1), where Yn and Y1 are the final and initial levels of the period. Table 2 gives three-year mean annual gains for 1977–83 in three stages, and their averages are close to each other, so a straight line can smooth the series. Statistical manuals require at least six observations for linear extrapolation.
Fig. 1 shows the actual mean values (broken line) and the values smoothed with Chebyshev numbers (solid line), plus a band of fluctuation drawn at one standard error of the line's equation on either side. The actual scores never left the band, so the equation is a sound basis for extrapolation to 1984–86 (shaded zone). It gives probable mean world-record scores of 465, 472.3 and 479.5 c.u. for 1984, 1985 and 1986.
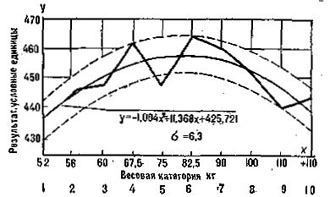
The scores in individual classes were then smoothed for each year of 1974–83 (Fig. 2 is an example) and divided by that year's mean. Averaged over the period, these ratios for the classes in order were 0.986, 0.997, 1.002, 1.004, 1.005, 1.008, 1.006, 1.004, 0.995 and 0.990. They served as correction coefficients in computing the single-number (point) forecasts for each class, given in Table 3.
Actual results seldom match point forecasts exactly, so confidence intervals are needed. For a linear trend the interval is Ŷt+L ± SyK*, where Ŷt+L is the point forecast for the lead period, Sy the standard deviation of the observations from the calculated values and K* a coefficient depending on series length, extrapolation period and Student's criterion, taken from tables. For the series in Fig. 1 at probability 0.9, K* is 2.638, 2.875 and 3.140, and the standard error is 4.8. For the 75 kg class in 1985 the interval is 475 ± 4.8 × 2.875, i.e. 461–489 c.u.; with probability 0.9 the 1985 world-record total of the middleweights will therefore be between 372.5 and 390 kg. Intervals for all classes were calculated the same way.
Table 3. Forecast of world records in the two-lift total
| Weight class, kg | Point forecast, c.u. | Confidence interval of forecast, kg | ||||
| 1984 | 1985 | 1986 | 1984 | 1985 | 1986 | |
| 52 | 458 | 466 | 473 | 260–267.5 | 260–272.5 | 262.5–275 |
| 56 | 464 | 471 | 478 | 292.5–295 | 292.5–297.5 | 292.5–302.5 |
| 60 | 466 | 473 | 480 | 312.5–317.5 | 312.5–322.5 | 312.5–325 |
| 67.5 | 467 | 474 | 481 | 345–355 | 345–360 | 347.5–362.5 |
| 75 | 467 | 475 | 482 | 370–385 | 372.5–390 | 377.5–395 |
| 82.5 | 469 | 476 | 483 | 400–412.5 | 400–417.5 | 402.5–422.5 |
| 90 | 468 | 475 | 482 | 420–430 | 420–437.5 | 422.5–442.5 |
| 100 | 467 | 474 | 481 | 440–450 | 440–455 | 440–460 |
| 110 | 463 | 470 | 477 | 442.5–460 | 447.5–467.5 | 450–472.5 |
| Over 110 | 460 | 468 | 475 | 460–480 | 465–487.5 | 470–492.5 |
| Average | 465.0 | 472.3 | 479.5 | |||
As printed; the third confidence-interval column is headed 1985 in the source, evidently meaning 1986.
Table 3 can serve in drafting classification standards for 1985–88 and model characteristics for selecting national-team candidates. The forecast rests on an analytical function of time, with time as the independent variable and the records as its function. Time drives growth only because it carries the content of proper preparation for new records; without such preparation, and without talented lifters able to set records, time alone will not secure further growth. These real preconditions must therefore be weighed alongside the statistical tendencies.